Looker Studio is a data visualization tool from Google, which is available for free or with a range of paid add-ons. It can connect to a wide range of websites and online platforms, allowing you to track a wide range of metrics and activity.
This article explains how to delegate marketing analytics to an assistant. This includes having dashboards you can check at any time, and getting regular reports to keep you up-to-date with marketing performance.
You don’t need to know Looker Studio’s ins and outs to do this. This will be handled by your assistant.
Give Your Assistant a Company Google Account
Give your assistant a Google account in your company’s domain.
A lot of company data will pass through Looker Studio, which could involve financial data, company plans or targets, and other confidential information.
To minimize risk, it’s best to limit sharing the dashboard to users within your company domain.
By giving your assistant a Google account on your domain, you can let them view and organize the data they’ll work with, while still protecting it from external users.
Have Your Assistant Connect Your Data
Tell your assistant what metrics you need to track. For example: conversion rates, qualified leads, or cost-per-acquisition.
From these metrics, your assistant will determine which data they’ll need. This may involve:
- Online performance data: website traffic, social media engagement, content management system metrics, etc.
- Company activities: ad spend, project targets, etc.
Your assistant can then connect the necessary data to your Looker Studio setup.
This may involve getting access to some of your other online platforms. Give them the necessary credentials, or share access using a password manager. Magic has its own secure password manager, Magic Vault, you can use to share this information with your assistant.
In addition to Looker Studio’s built-in connectors, you can choose from a wide range of partner connectors. These allow you to link data from sources like Amazon, Shopify, Hubspot, Semrush, etc. Partner connectors are also available for free.
Review the Dashboard
Once your assistant has set up the dashboard, have them run it by you.
The first time you go over it, you should do so without your assistant’s input. You should generally be able to understand the data on your own. Having a self-serve dashboard makes it easier to share data across your team or company.
Then, you can have your assistant explain the finer details or clarify anything that was confusing.
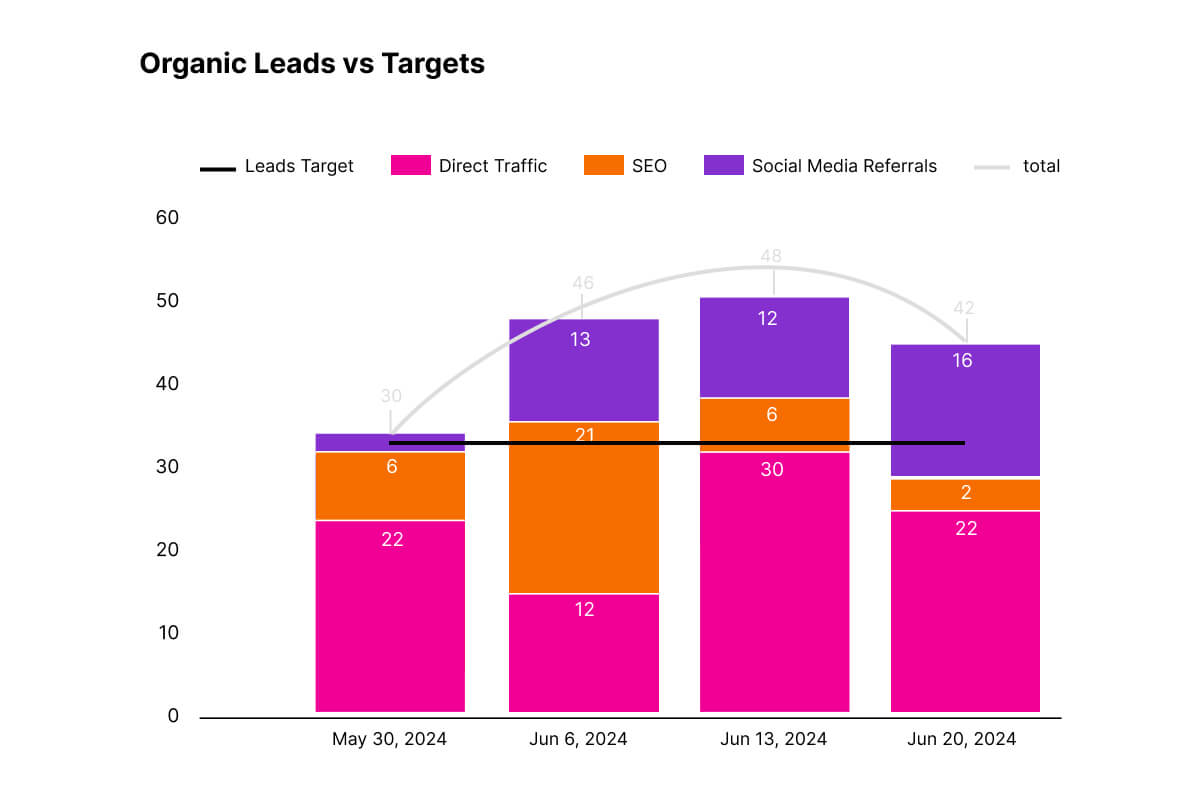
Visualizations can be designed to display data alongside company targets, or to break information down into appropriate categories.
Let your assistant know if there are any changes they need to make to the visualizations, or how data is presented.
- Metrics: Are there additional metrics you’d like to see included?
- Visualizations: Are there any metrics that would be better presented with a different graph type? Is the data accurate and legible? Are targets reflected where they should be?
- Organization: Is it easy to find the data you’re looking for on the dashboard? Are visualizations grouped and ordered in a logical way?
Your assistant will iterate on the dashboard as you go. Continue to give feedback as necessary, until the dashboard suits your company’s needs.
Your assistant will choose the graph they consider best for the situation. If it does not suit your needs, have them use a graph that better presents the info you’re looking for.
Review Weekly Reports
Your assistant will send you weekly reports on the metrics you’re keeping track of.
They can send this by email, or through a messaging channel of your choice. Similarly, they can send these to any other recipients you specify.
The reports should include screenshots of the data visualizations, as well as an explanation of changes in the metrics.
- An overview of the performance for the week
- A week-on-week comparison of each metric
- How each relevant metric tracks against company goals
- Standouts or anomalies in the data, and potential reasons for this
When appropriate, the report should also mention changes in how the platforms you use track and measure data (e.g. when social media platforms change their measurement criteria or procedures).
As you receive the reports, give your assistant feedback on anything that needs improvement. This could be in how the reports are drafted, or when and how they’re delivered. Over time, your assistant will be able to anticipate your preferences and adjust the reports accordingly.


